
An annual report doesn’t have to make readers choose between clear data and a compelling story. Making annual reports more engaging with video means placing short videos where they add context: a year-in-review near the opening, interviews alongside people-focused stories, animated charts beside com...

An annual report doesn’t have to make readers choose between clear data and a compelling story. Making annual reports more engaging with video means placing short videos where they add context: a year-in-review near the opening, interviews alongside people-focused stories, animated charts beside complex results, and case studies near the work they bring to life. Keep the written report as the foundation, and use video to add perspective.
Annual reports communicate performance, priorities, and impact to audiences with different interests. Video can make those messages easier to follow, but placement matters: even a well-made film can feel disconnected if it interrupts the reader instead of supporting the information on the page.
This article shows where to incorporate video and how to match each format to its message. Annual highlights and interviews can put people behind the results, animated data can clarify trends, and case studies can connect organisational goals to real experiences. The aim is a report that feels more human and memorable, without adding video for its own sake.
• Place each video beside the report content it explains, so readers can connect the story with the supporting detail.
• Choose interviews, leadership messages or highlights to reflect what different stakeholders need to understand.
• Use clean, clearly labelled animated charts to make trends and complex figures easier to follow.
• Build case studies around real examples that show how organisational priorities translate into impact.
• Use a few purposeful videos alongside the written report, rather than adding motion where it doesn’t strengthen the message.
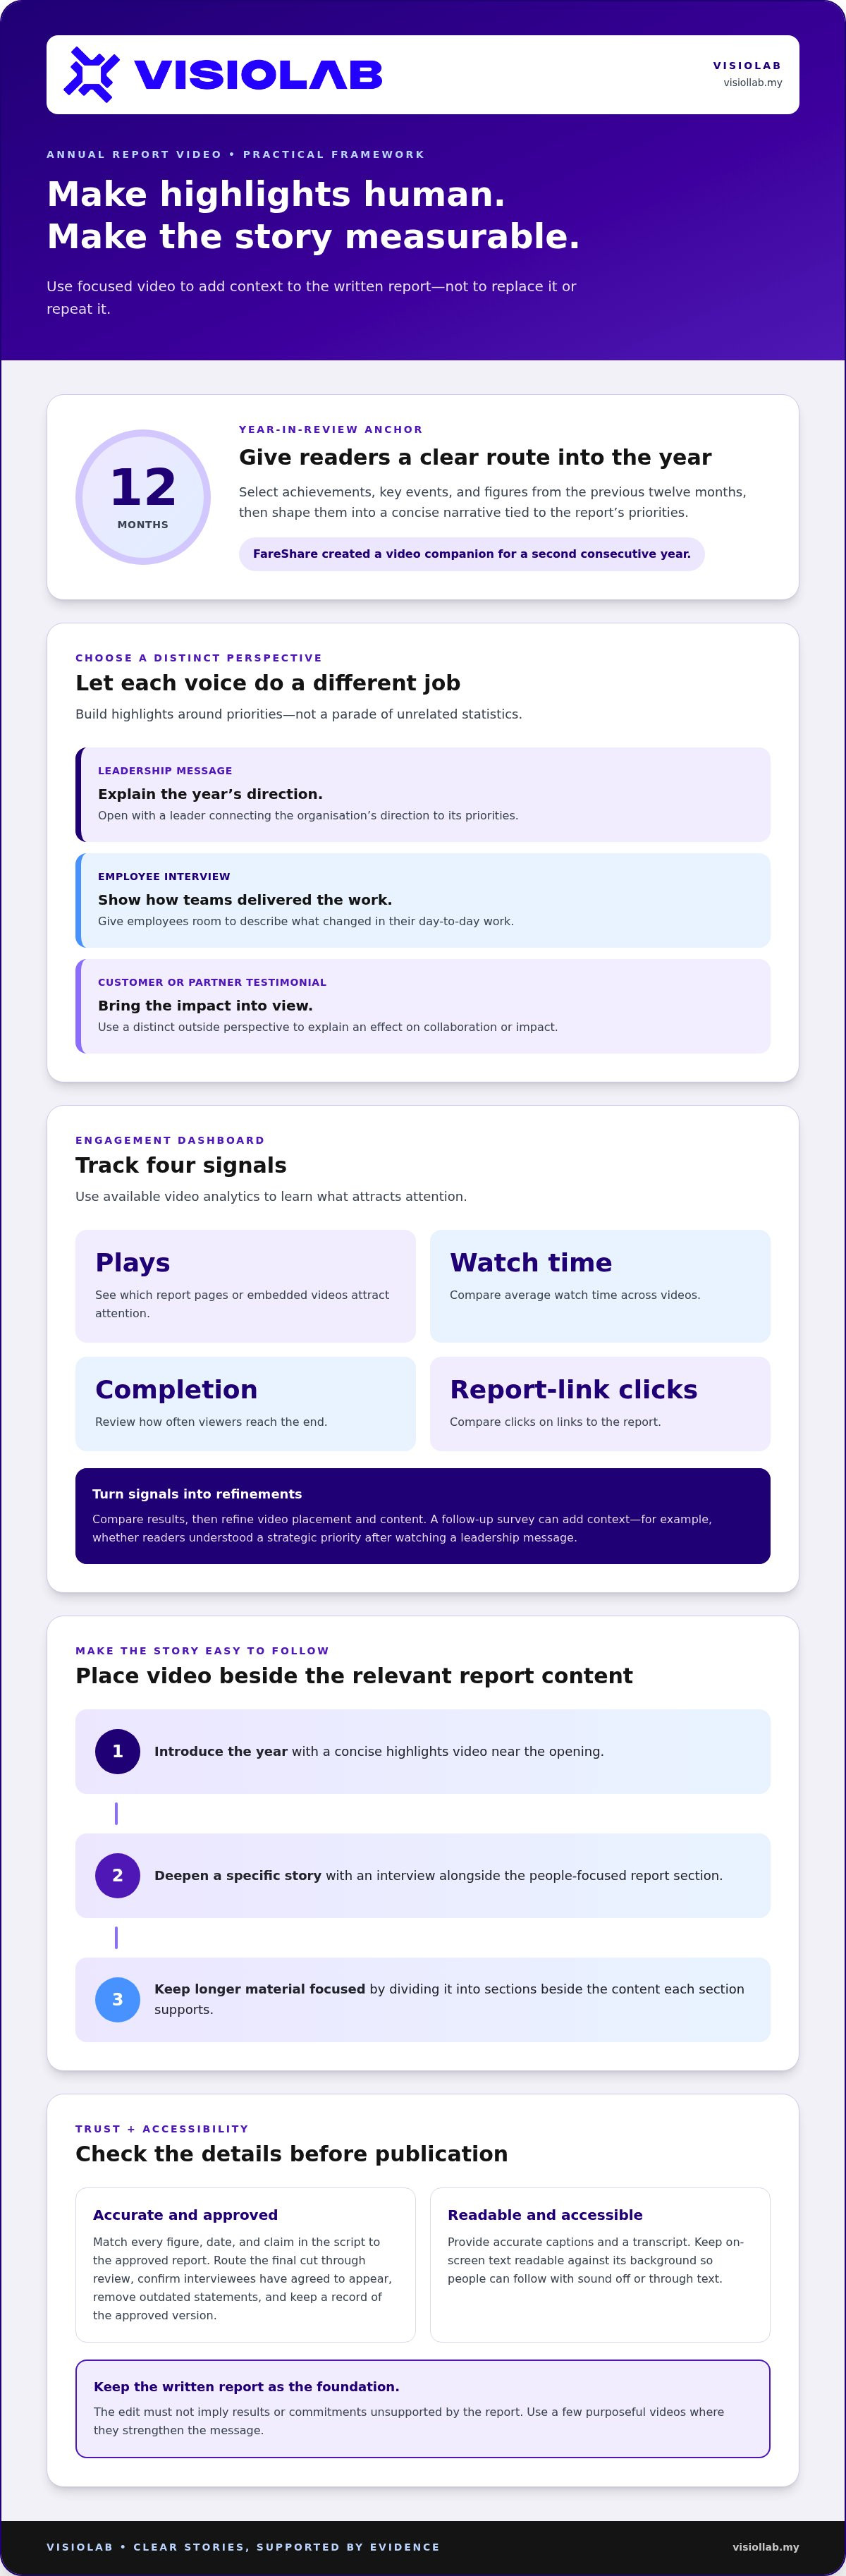
A year-in-review video can give readers a clear route into an annual report. Select achievements, key events, and figures from the previous twelve months, then shape them into a concise narrative. FareShare used its annual report video to summarise the year and bring its food rescue and distribution process to life for donors, suppliers, volunteers, and charity partners. The team created a video companion for a second consecutive year.
Build the highlights around the report’s priorities, not a parade of unrelated statistics. Open with a leader explaining the year’s direction, then use employee interviews to show how teams delivered key work. Add a customer or partner testimonial when it demonstrates impact. Each speaker should offer a distinct perspective: an employee might describe a change in daily work, while a partner explains its effect on collaboration.
For accessibility, provide accurate captions and a transcript, and make on-screen text readable against its background. These steps help people follow the video with sound off or through text. Keep a highlight video focused on its central message; divide longer material into sections placed beside the relevant report content. A short video can introduce the year, while a separate interview deepens a specific story.
Measure engagement using available video analytics: compare plays, average watch time, completion, and clicks on report links. See which report pages or embedded videos attract attention, then use that evidence to refine placement and content. A follow-up survey can add context, such as whether readers understood a strategic priority after watching the leadership message.
Address accuracy and governance before publication. Match every figure, date, and claim in the script to the approved report, and route the final cut through the organisation’s review process. Confirm interviewees have agreed to appear, remove outdated statements, and keep a record of the approved version. The edit must not imply results or commitments unsupported by the written report.
An interactive annual report can place videos beside related sections instead of gathering every film on one page. Choose a responsive digital format, then add clear headings, menus, clickable links, and captions. Test the report on desktop, tablet, and smartphone screens before publishing. Check that video controls, navigation, and text remain usable.
Interactive elements can help stakeholders explore at their own pace. Investors may go straight to financial results, while employees may choose culture and achievements. Add a clickable timeline connecting milestones with short clips, or an interactive chart that reveals an explanatory video beside a selected result. Tie each feature to a question readers need answered.
Measure the report as a whole by reviewing video plays alongside navigation paths, link clicks, and feedback. If readers reach a timeline but don’t open its related clips, adjust the labels or placement. This creates a navigable experience: highlights orient readers, interviews add human perspective, and interactive data lets them explore the detail behind the story.
Start with the report’s central message, then choose a video format that makes it clearer. For a story about strategic change, a leadership explanation can connect decisions with outcomes. If it centres on sustainability, a field story can show how the work happens. Video should add perspective, not simply repeat the report’s opening summary.
Map content to each audience’s priorities. Investors may want context around financial performance, risks, and future direction. Employees may value a view of team achievements and workplace culture. Customers and partners may look for evidence of service, innovation, or shared impact. Write one audience question beside each report section, then use video only where it helps answer that question.
Build a simple narrative before drafting the script: the challenge, the organisation’s response, and the outcome. For example, a video about a new operating approach can explain what changed, show how teams adapted, and connect the result to a stated priority. Keep every claim aligned with the report’s language. This helps readers absorb the message without losing the detail behind it.
For a Malaysia-facing annual report, use video as a companion to formal disclosures, not as their replacement. Keep financial and governance information in the report, and ensure video statements match the organisation’s approved disclosures. Video can explain context, but it shouldn’t be the only place readers can find material information.
Choose the format according to the available evidence. A customer testimonial can put a service outcome into human terms; an animation can clarify a process; a product demonstration can show how a feature works. A leadership message can explain direction, accomplishments, challenges, or strategic shifts. Give each video one clear purpose instead of combining every format in one film.
Plan distribution as you choose the content. Share the annual report video through the organisation’s website, newsletter, and relevant social channels. Place it beside the related report section, then use a short email introduction to guide stakeholders to that context. Keep the report itself easy to access.
Before production, create a brief with the intended audience, core message, supporting report section, and final destination. This keeps the script and edit focused. For a leadership narrative or stakeholder story, video storytelling for annual reports can help turn complex organisational messages into a clear visual account.
Keep the story anchored to the report’s overall message, and let the video carry it through a focused progression. When selecting or creating an annual report video, use a clear narrative that supports the report’s purpose. Make the connection between the report’s point and its supporting material easy to follow, while giving the video a distinct purpose instead of trying to cover everything.
Tailor the emphasis to the people who will watch. Investors may focus on financial information, while employees may value company achievements and culture. Consider which details help each audience understand the message, and keep them consistent with the relevant report material. A focused story can serve different stakeholders while giving each group a relevant way into the report.
Making annual reports more engaging with video starts with a clear purpose for every visual. Use an animated counter when one verified figure deserves emphasis, such as total projects completed or people reached. Show its label and reporting period, then animate it once into view. Keep the final figure visible long enough to read, and match it to the approved report data.
Choose a chart based on the relationship readers need to understand. A pie chart can show distribution across categories, while a line chart can reveal a trend over time. For example, use a line chart to show how energy use changed across reporting periods. Add clear labels, units, and a concise caption explaining what the data represents.
For a corporate report covering several performance measures, group related information into a visual sequence. Start with the strategic objective, show the relevant chart, then explain the result. A timeline can connect milestones with outcomes, while a bar chart can compare categories. This gives readers context before they interpret the figures.
Animations can clarify movement that a static chart may not convey. In an interactive report, a hover animation can reveal a label or highlight a selected category. Use it to support exploration, not to hide essential information behind an action. Keep the chart readable without interaction, especially for readers using touchscreens or assistive technology.
Complex topics can benefit from more than charts alone. Pair a graph with an illustration, voice-over, or labelled diagram. For example, a multimedia explanation of a supply chain can show each stage visually, while a nearby chart presents distribution data. The visual explains the process; the figures provide evidence.
Before publication, check each visual against its data source and the report narrative. Confirm that labels, colours, and units remain consistent throughout. Brand colours can distinguish categories, but add labels or patterns so meaning doesn’t depend on colour alone. Reviewers should be able to trace every animated counter to its corresponding approved figure.
Keep each graphic focused on one main question. If it compares regional performance, identify every region and use the same scale. Remove decorative elements that compete with the data. Clear titles and concise annotations help readers see the pattern without needing a lengthy explanation.
For organisations making annual reports more engaging with video, data visuals should strengthen the story without distracting from the evidence. Test every graphic on desktop and mobile screens. Check that text remains legible, motion purposeful, and charts understandable without animation. The result should make findings easier to grasp while preserving the detail stakeholders need to assess them.
A case study gives stakeholders a human-scale view of an organisation’s results. Instead of presenting a sustainability target alone, show one project, the people involved, and what changed. LC Packaging’s 2023 annual report focused on sustainability, illustrating how a defined theme can give report storytelling a clear centre. Choose examples that connect directly to the report’s priorities.
Start storyline development by drafting 3-4 sentences that summarise the year’s central story. Identify the organisation’s challenge, its response, the evidence of progress, and what comes next. For example, a Malaysian organisation describing a community programme could introduce the local need, show the activity, include a participant’s perspective, and close with the report’s stated outcome.
To plan and produce an annual report video, choose a report-backed story, confirm its evidence and interviewees, then write a concise script and storyboard. Record interviews and supporting footage, edit them into a clear narrative, and review every claim against the report before publication.
Use the interview to reveal a specific moment, not repeat a corporate slogan. Ask an employee what changed in their work, or a project partner to describe a practical result. Pair the answer with relevant footage, such as a team carrying out the work. This sequence makes an abstract concept easier to understand and more accessible to readers.
Keep evidence visible throughout the story. If a speaker describes improved access to a service, identify the programme and reporting period on screen, then link the video to the supporting report section. Use approved figures and distinguish personal experience from an organisation-wide result. This protects the narrative’s credibility without removing its human detail.
Shape the edit around a beginning, middle, and end. First establish the need, then show the organisation’s response, and finally explain the outcome and its relevance to stakeholders. A short voice-over can bridge interview clips, while captions and a transcript help readers follow without audio. Keep music and visual effects subordinate to the speaker’s meaning.
Choose a case study that represents the report’s message, not merely the most dramatic footage. For an environmental story, show the project setting, explain the action taken, and include evidence connected to the stated goal. If the report covers several priorities, give each example its own place in the document instead of forcing unrelated stories into one film.
Before release, compare the final edit with the report’s approved wording, figures, and time period. Check names, captions, and the context around each interview quote. Then place the video beside the related case study, so readers can move from the personal account to the documented detail and understand both parts of the story.
A video annual report brings voice, movement, and people into the story; a PDF is easier to scan, save, and search. An interactive web report can combine both with clickable navigation, charts, and embedded video. For a Malaysia-facing organisation, treat video as a companion to the report, not a substitute for detailed disclosures.
Video can make achievements more engaging by showing the people and decisions behind them. A leader can explain a strategic shift, while footage illustrates its effect on a project or community. Keep the video beside the relevant written section, so readers can move from the highlight to supporting detail without losing context.
Interactive content has been associated with 52.6% more engagement than static content and a 94% increase in content views compared with PDFs. These figures concern interactive content overall, not video alone. They point to a useful design principle: give readers a reason to explore, then make each element relevant to the report’s message.
Develop a digital report around reader tasks. Put a concise overview at the start, use clear section labels, and make key charts clickable when deeper detail adds value. For example, selecting a regional result could open the corresponding explanation or case study. Keep essential figures visible without requiring clicks or video playback.
Use a small number of purposeful videos rather than turning every page into a viewing experience. A year-end highlight can establish the main narrative; a short interview can add a personal perspective beside a specific achievement. If a video covers several topics, divide it into sections and place each segment near its related content.
The document still matters. A PDF offers a stable reference for readers who want to review figures, copy details, or read without streaming. A web report adds navigation and multimedia; video contributes tone, movement, and explanation. Maintaining these formats together gives stakeholders options without making one format carry every task.
Before publishing, test the digital report on desktop and mobile screens. Check that clickable elements work, captions are readable, and each video has a clear title and transcript. Review the edit against the approved report, especially where spoken highlights describe performance or future plans. These checks help preserve accuracy while adding a more human presentation.
Use video when a voice, visual example, or process can clarify a point that text alone may flatten. Keep searchable detail in the document, and use interactive features to guide readers to the right depth. To develop an annual report video that supports your organisation’s message, plan a corporate video for your annual report.
VISIOLAB creates Corporate Video content that brings an annual report’s priorities, people, and results into focus. Turn to this approach when the written report needs a clear visual narrative, such as a leadership message, year-in-review, or organisational story. For complex processes, Explainer and Training Video can make information easier to follow. ESG Video can support sustainability storytelling with relevant visuals and stakeholder perspectives.
The next step is to shape the video around the report’s central message and the audience it needs to reach. A focused brief connects the script, interviews, visuals, and final placement to the report, rather than treating the film as a standalone piece. To discuss a video for your annual report, visit visiolab.my.
Use your next reporting cycle to plan video alongside the report, not as a last-minute addition. Start with the message stakeholders should carry forward, then decide which moments deserve a voice, a visual explanation, or a human perspective. That early choice can bring the script, interviews, and placement together in one coherent experience.
Making annual reports more engaging with video works best when the creative idea serves the organisation’s communication goals. VISIOLAB’s Corporate Video can bring an organisation’s story into focus, while Explainer and Training Video can clarify complex processes. For sustainability narratives, ESG Video can connect commitments with the work behind them.
Bring your report’s central message and intended audience into the planning conversation. Contact VISIOLAB to discuss your video and explore a direction that fits your annual report. A clear story can help your next report feel purposeful, human, and ready to move forward.
Place each video beside the information it helps explain, with a clear label telling readers what they’ll gain by watching. For example, position a governance overview near the governance discussion, not among unrelated corporate highlights. On a digital report page, include a short text introduction and transcript near the player. This gives readers context to decide whether to watch and helps them return to the written detail.
The best format depends on the report’s purpose. A leadership message can explain a change in direction; a customer or partner interview can illustrate a relationship; and a concise animation can clarify an unfamiliar process. Use an interview when a person’s experience adds perspective, but choose animation when the explanation relies on abstract steps. Give each video one primary purpose so the format supports the report rather than competing with it.
Let’s create and collaborate
We’re versatile multitaskers, and we thrive on a lot of projects. You've seen a few of our works that we are most proud of, and your project could be next in line.

Empowering brands with captivating visual stories, creating strong connections and growth.
